

Advanced reporting


As a commission program owner, you’ll definitely welcome a quick overview of how successful your affiliate is. Would you like to know the answers to these questions at the click of a button?
- How many affiliates do you actually have in total and how many of them are actually active? How do these numbers change over time? Is your trend positive?
- What kind of turnover have your partners brought you?
- What is your conversion rate (how many clicks to one purchase?)
- What is the average order amount from your partners?
- What is the quality of orders – how many have actually been paid for and therefore approved?
These answers and much more can be found in Advanced Statistics. In two tables and clear graphs you will see everything clearly.
Chapters
How to set them up
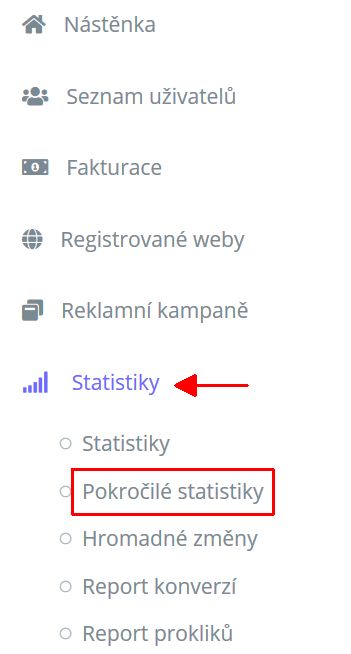
In the left menu of your AffilBox license, select the Stats tab and the Advanced Stats sub-tab.
At the top of the screen you will see a general overview – number of affiliates, visits, conversions and commissions.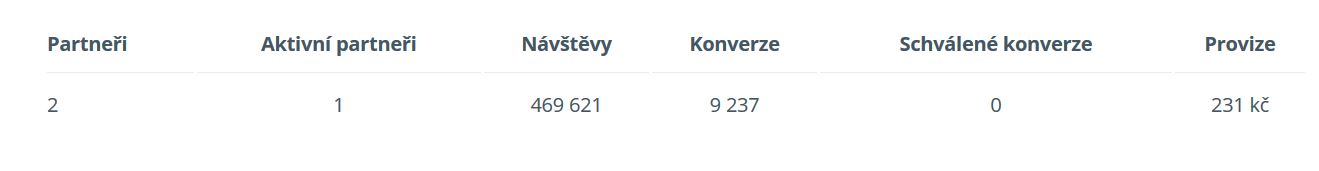
This overview is independent of the parameter selection below.

Refining data selection
You can then refine your data selection below this table. You can choose what time range you want to display your statistics. If you need to narrow down your selection, choose which campaign or partner you are interested in data from. Finally, don’t forget to click the Show Results button.
You will then see two graphs and a table below.
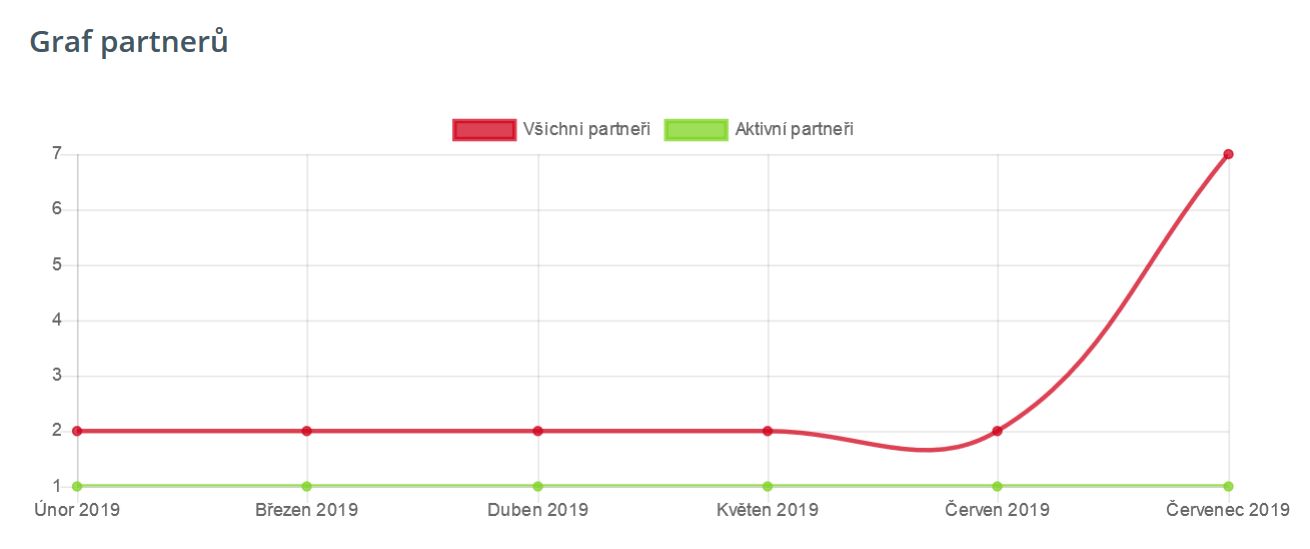
Number of partners – graph
The first graph is about the number of partners. The blue line shows the number of your partners in the given months, the red line shows the number of active partners. It’s not how many partners you have, but whether they are actually promoting you.
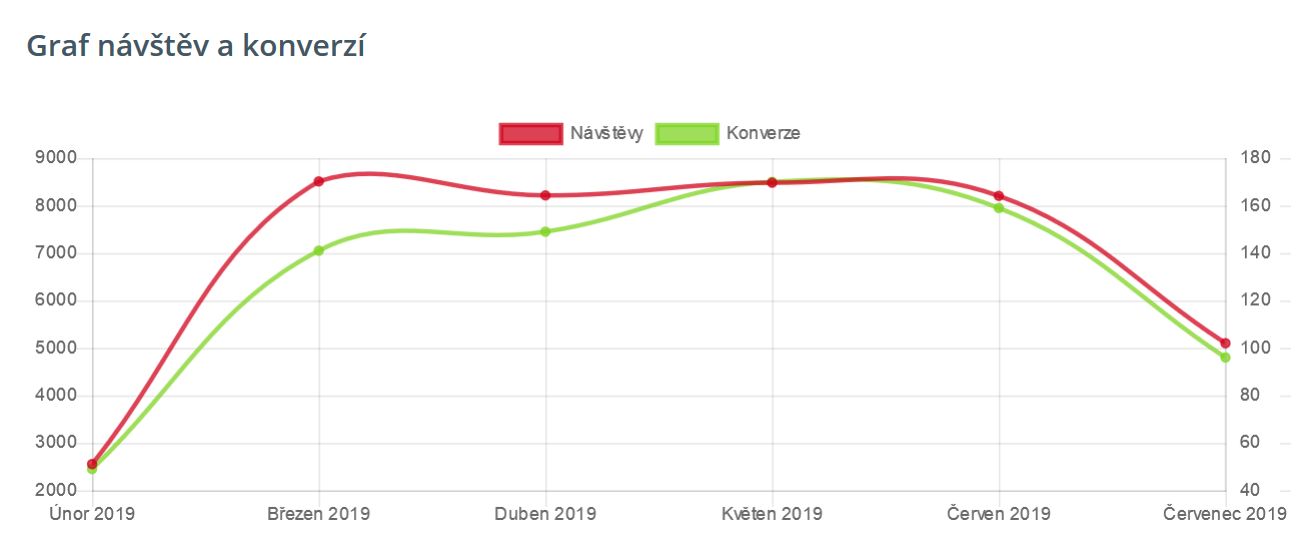
Visits and conversions – graph
The second chart is called Visits and Conversions. Visits are marked in blue – one visit is defined as a click through an affiliate link to your site. In red you can see the number of conversions in a given month. For example, if you have made a change to your site, a change in the ratio of these two lines may indicate that something is wrong.
Monthly overview – table
At the bottom of the page you will find a very interesting table – you will see how you (and your partners) did in each month of the selected period.
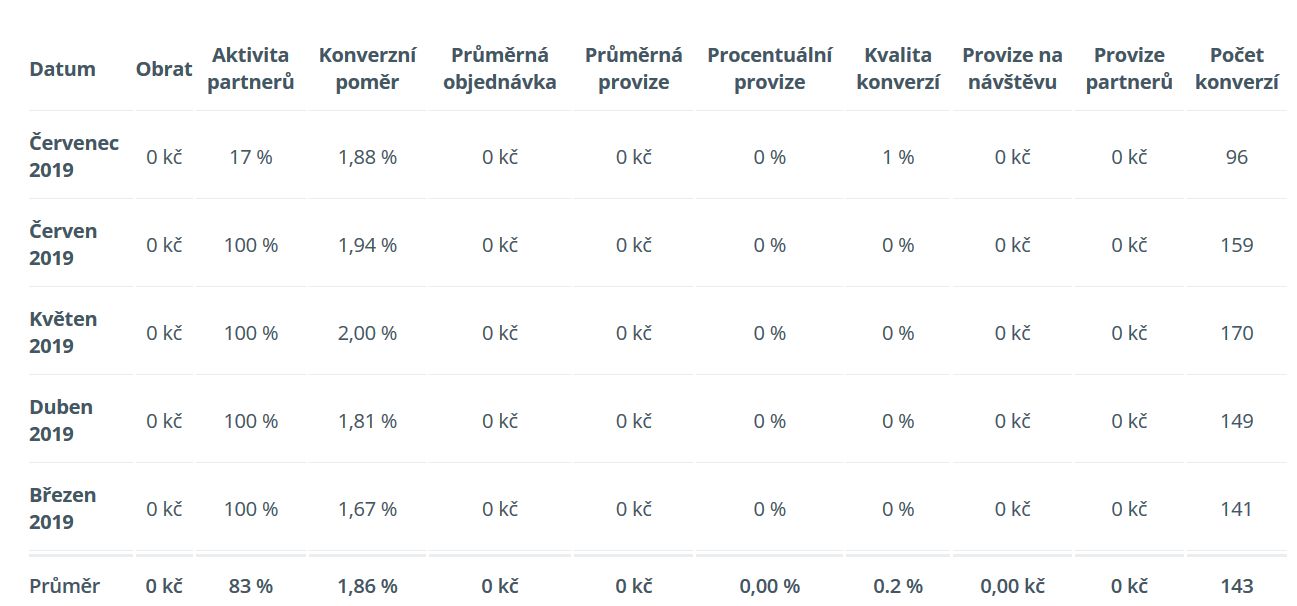
What do the columns mean:
Here follows a brief explanation appears when you hover over the column name.
- Turnover – turnover means the sum of the value of orders from your partners.
- Partner Activity = the ratio of active and inactive partners. Active partners are partners who have brought you at least one click in a given period. Inactive partners = the number of partners on the first day of the month with no active partners. The higher this number is the better – you are able to engage more and more partners. You can learn how to activate them in Affiliate academy.
- Conversion rate = Conversion rate is the number of conversions divided by the number of visits your customers get from your affiliates (click-through rate). Compare this ratio with your other promotional channels. Track the change. If the trend is downward, it would be a good idea to reach out to partners and find more effective avenues of promotion.
- Average Order Value = Total sales from orders from partners/number of conversions from partners. If you have a skillful partner, they can increase this value for you. The trend of this value should ideally be upward.
- Average Commission = What the average commission is per order. It is calculated from the total affiliate commission/number of all conversions from affiliates. From this amount you can derive how much your commission program is meaningful for your affiliates – it must not fall below the break-even point.
- Percentage commission = It is calculated as the total sum of order value (turnover)/commission for affiliates. It depends on how many campaigns you have – if you have more than one, it can be an important indicator of what partners are doing and what your costs are. You can compare with other channels.
- Quality of conversions = It’s calculated as the number of conversions approved / the number of total conversions. It tells you how quality of visitors your partners are bringing in, if there is something wrong in your ordering process (if there is a downward trend), or if your partners are providing any misleading information such as shipping or payment.
- Commission per visit = It is calculated as the total commission of all your partners/number of visits – clicks from your partners. Again, increasing numbers are welcome, they mean that your partners are likely to bring you more and more quality visitors (because they will also buy from you).
- Affiliate Commissions = The total value of all affiliate commissions in a given period.
Data export
You can also download all this information to a CSV file – you can find the button at the very bottom of the right corner.
And be sure to watch the video on how to handle the information from the statistics and what conclusions to draw from it.
Article and video on evaluating commission program statistics
Leave a comment
Your email address will not be published. Required information is marked with *